As a lifelong Liverpool fan, I marveled at a fact I read earlier this week: the reds could have lost every single game after the season restarted and yet still have secured the title. Reflecting on this fact, however, I questioned whether this large gap between the top and bottom clubs was a one season phenomenon or evidence of a growing trend. In other words, is the Premier League becoming less competitive?
To measure ‘competitiveness’, I collected league table data for every full Premier League season since 1995/1996. I then calculated a Gini coefficient to measure the amount of ‘inequality’ in the distribution of points among the teams.
For those unfamiliar with the Gini coefficient, it is an economic measure most commonly used to represent the inequality in the distribution of wealth or income within a population. It ranges from 0 to 1, where 0 represents total equality (everyone has the same amount of wealth/income) and 1 represents total inequality (one person has all the wealth/income). Thus, the higher the gini coefficient is, the more unequal the distribution of a variable is. In this case, we are looking at the distribution in the number of points gained by each team.
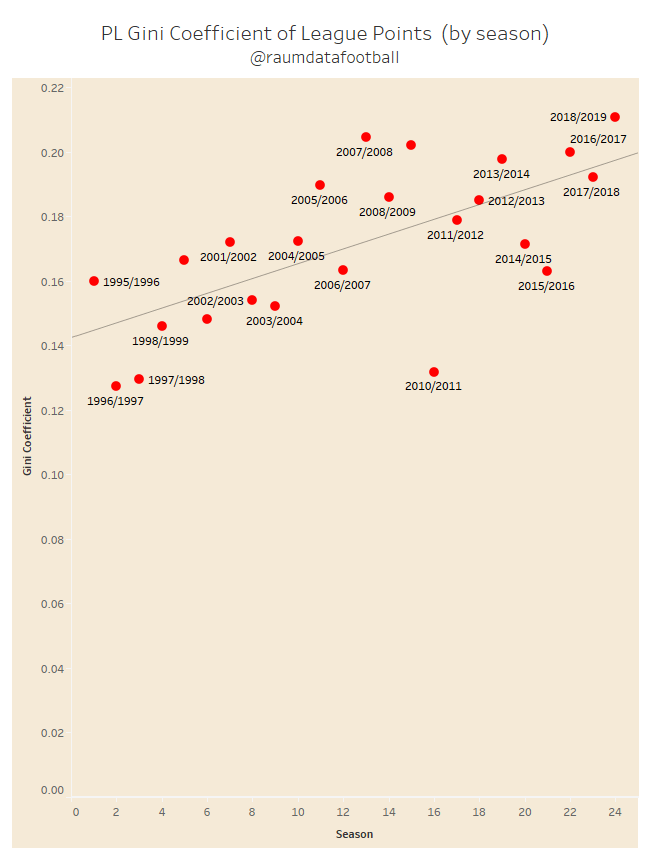
Figure 1 shows the gini coefficients for each season from 1995/1996 to 2018/2019. Interestingly, 2018/2019 was the most unequal Premier League season of all time while 1996/1997 was the most equal season of all time. Leicester City’s title winning season (2015-2016) ranks among one of the most equal seasons in recent times. The 2010/2011 season is also a notable outlier.

What is clear from the data is that there has been a general upward trend in the Gini coefficient since the Premier League began (figure 2). In other words, one may say that the Premier League is generally becoming ‘less competitive’. Of course, this does not mean that the general quality of Premier League football is decreasing (in fact, I’d be more compelled to believe the opposite.) But what it does mean is that the proportion of total points held by the top clubs is generally increasing each season.
You may have noticed that the current season is not included in the data. That’s because it isn’t yet complete (I may write an update when it is.) Liverpool’s dominance, to my delight, is almost unprecedented and Klopp’s men are on course to break multiple records. What isn’t such a brand new phenomenon, however, is the growing dominance by the top clubs – Liverpool, Man City, Chelsea, Arsenal, Spurs and Man United. Perhaps the recent success of clubs like Leicester, Sheffield United and Wolves may soon disrupt the growing trend but given the wealth gap between the ‘big six’ and the rest, I think we may have good reason to doubt that assertion.
(In case anyone is interested, below is the R code that I used to calculate the Gini coefficients):
## read the data from correct file location
pldata <- read.csv(“C:/Users/Josh/Desktop/Europe Leagues Data/premierleague.csv”)
## vector to store gini for all seasons
all_gini <- rep(0, 24)
## index to loop through data
x <- 0
## index to put the gini coefs
j <- 1
## loop through all seasons in the data (24 in total) and calculate gini coefs
while(j<25) {
totalpts <- 0
for (i in (1+x):(20+x)) {
totalpts = totalpts + pldata[i, 12]
}
expected <- cumsum(rep((totalpts/20)/(totalpts), 20))
real <- cumsum(pldata[(20+x):(1+x),12]/(totalpts))
cumpopulation <- (1:20)/20
## plot the lorenz curve and line of equality
plot (cumpopulation, expected, type=”l”, col=”dark grey”)
points(cumpopulation, real, type=”l”, col=”red”)
## estimate of area between the lorenz curve and line of equality
area <- sum((expected-real)*0.05)
## calculate gini coef for that season
gini <- 2*area
all_gini[j] <- gini
x = x + 20
j <- j + 1
}
## view gini coefs
all_gini
