Kepa Arrizabalaga may play in goal but come the next transfer window, Chelsea may no longer consider him a ‘keeper’. Forgive my terrible puns and let me explain why the Chelsea number 1 has been the worst goalkeeper in the Premier League so far this season.
Traditional xG models are built with the goal of evaluating the player taking the shot. However, football data companies such as StatsBomb have managed to build models that instead evaluate the goalkeeper.
xG models focused on evaluating goalkeeping performance are commonly known as “post shot xG” models. This is because, unlike traditional xG models, they calculate xG values by looking, among other factors, at where a shot ends up. Let’s take the example of a shot taken from far outside the box that ends up going into the top corner of the goal. Mo Salah’s goal vs Chelsea last season comes to mind.
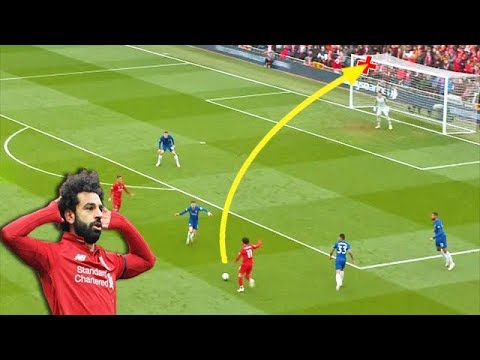
In a post shot xG model, Salah’s effort will have a high xG because, typically, shots that go into the top corner often result in a goal. In contrast, this same shot will have a low xG in a traditional xG model since this model does not care where shots end up but does care how far away they were taken from the goal (which, in this example, is fairly far away).
There are other factors built into post shot xG models and you can read more about these models, courtesy of StatsBomb, here. For this analysis, the important thing to note is that post shot xG models can be used to evaluate goalkeeper performance since they tell you how many goals a keeper would be expected to concede given the shots that they have faced. If a keeper concedes significantly more goals than their total post shot xG, that may be a sign of poor performances. On the other hand, a keeper conceding significantly less than their total post shot xG is clearly performing well.
To analyse goalkeeping performances in this season’s Premier League, I looked at the difference between each keeper’s total post shot xG and their total goals conceded. I then visualized this data for goalkeepers that had played at least 15 games. Negative values (shown in red) are a sign of poor performances while positive values (shown in green) are a sign of good performances.
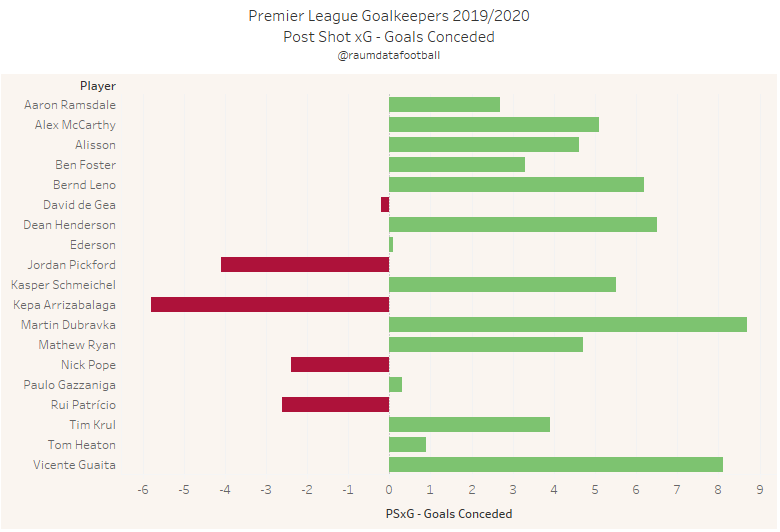
As evident in the chart, Kepa ranks the lowest on this metric while Newcastle goalie, Martin Dubravka, ranks the highest. To put this into a little more context, Kepa has let in almost 6 more goals than expected while Dubravka has let in almost 9 goals less than expected. Some other notable goalkeepers in this chart are Everton’s Jordan Pickford (2nd worst) and Crystal Palace’s Vincent Guaita (2nd best).
In defense of Kepa, one may argue that the sample size of about 25 games is not the best reflection of his ability. He may simply be going through a rough patch, as all players sometimes do. But while this may very well be true, goalkeepers play such a critical role in teams that a single bad performance can make or break a team’s season (just ask Liverpool).
Given that Kepa is the most expensive keeper in football history, much is expected of him. Lots of factors affect player performances and perhaps the added pressure of the hefty price tag may be on the Chelsea keeper’s mind. Either way, clubs splash the cash on players so that they can perform. If they don’t, like Kepa isn’t at the moment – they may soon be back on the transfer market.
/cdn.vox-cdn.com/uploads/chorus_image/image/63118372/1127118479.jpg.0.jpg)
Anyone know a club looking to sign an under-performing goalkeeper for about £71.5M?
